The economic news has been so disappointing for so long that even the trickle of good news seen over the last few weeks is emerging as the strongest run for almost a year. But, as the chart shows, there’s a big divergence between the now severely disappointing results emerging from the US and the improving trends seen in Asia and, to a lesser degree, Europe.Asia: The improvement in Asia’s data is the major discovery of the last few weeks. The sharpest improvement has come, of course, from China, where very modestly positive results have defied some extremely beaten-up consensus views. More encouraging because more broadly based, has been the gentler sustained recovery in economic data from the rest of Asia (excl. Japan). US: Until the last fortnight, it has been possible to view the US economy as gradually becoming less disappointing relative to consensus views – partly because consensus expectations have soured, and partly because the data is gradually becoming only moderately weak. But the last two weeks have been painful, with a broad array of data arriving sharply weaker than expected. At this point, anticipations about Federal Reserve interest rate hikes seem misplaced. Europe: In Europe, the modest but sustained expansion reported by the Eurozone is securely grounded in rising employment, which itself is underpinned by rising labour productivity. This expansion owes practically nothing to monetary accommodation, but nevertheless may yet be sabotaged by renewed financial crisis. Meanwhile, the contrast with the UK could hardly be plainer, where the economy is faltering precisely because labour markets have lost the underpinning of productivity gains and, like the Eurozone, there is precious little financing support for the business cycle. |
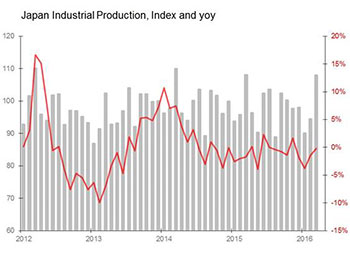
 Opportunities and threats The opportunities and threats remain as before: a weakening dollar and stable-to-rising commodity prices helps the US, China and those Asian industrial economies still fundamentally linked to the dollar. Meanwhile, it puts pressure primarily on Japan and the Eurozone. This fundamental re-ordering of economic pressures has yet to really show in the economic data, but it will.Three key surprises Japan industrial production; China industrial profits; Japan construction orders Japan industrial production The shape of the surprise suggested it was driven by an upturn in capital spending: the biggest gains were made in fabricated metals +11.9 percent mom, general purpose equipment +8.2 percent and transport equipment +8.8 percent mom. That in itself is a surprise: earlier in the month, Bank of Japan’s 1Q Tankan survey found large companies expected to cut their capital expenditure by 0.9 percent this fiscal year. That’s hardly surprising: February’s industrial capacity utilisation rate fell to 94.5 percent, the lowest since December 2012, and it is unlikely that even March’s rise in output will have restored it even to the long-term average rate of 98.2 percent. There’s no sign of any uptick in machinery orders either, with core machinery orders down 9.2 percent yoy February, whilst March’s machine tool orders fell 21.2 percent yoy. Nevertheless, the domestic picture is not entirely discouraging: housing starts rose 8.4 percent yoy in March, and construction orders jumped 19.8 percent yoy. But if Japan’s capital goods industries are really to prosper, they need the support of the global economy. And here, it is just possible that March’s sectoral strength is part of a bigger picture. Globally, over the last month, the flow of economic indicators for investment spending have finally overturned the negative momentum which has persisted since the middle of December. For all that, it will take more than a single month’s data to confirm an unlikely industrial upturn in Japan. A closer look suggests scepticism is warranted: manufacturing output jumped 3.8 percent mom, but shipments rose only 1.4 percent, with the extra production resulting in a 2.8 percent mom rise in inventories. In fact, March’s output pushed Japan’s inventories to their highest level since January 2009, with a monthly jump 2 SDs above what one expects in March. This has left the inventory/shipment ratio up to the highest point since August 2015. Unless there’s a recovery in demand for Japan’s products in the coming couple of months, Japan’s manufacturers will discover a need to work down that inventory/shipment ratio quickly, either by cutting prices sharply, or slowing production. And with the yen rising against the dollar by 2.8 percent mom and 8.8 percent yoy in April, the price-cutting route to shifting the inventory build-up looks increasingly painful. |
 China industrial profits Wednesday 27th April • China March industrial profits surprise +11.1 percent yoy, highest since July 2014 – Sales +4.4 percent yoy, highest since Oct 2014 – Operating margins up 0.3pps yoy to 6 percent – Accounts receivable jump 8.5 percent yoy, but inventories of finished goods almost unchanged yoy – Manufacturing profits +14.6 percent ytd, with telecoms +35.9 percent, Chemicals +20.8 percent, electrical equipment/machinery +18 percent – Drags: iron & steel smelting down 15.8 percent ytd, non-ferrous smelting down 4.3 percent, general purpose equipment +1.3 percent only – Mining down 108.5 percent ytd, power production/supply +4.6 percentJapan construction orders Thursday 28th April • Japan March construction orders surprise +19.8 percent yoy Three key shocks What’s the problem? Dig deeper and it looks like unfocussed funk. Those surveyed by the University of Michigan replied that although the current situation looks good, and they remain confident of their family finances, they think business is in for a hard time, and with it the country. The Conference Board’s panel told a similar story: the current situation was good, and in particular jobs were plentiful, but they expected business conditions would deteriorate. This sort of sustained fall in confidence matters particularly now because over the last year the big surprise from the US economy has been the extent to which domestic demand has been practically unaffected by the sharp and unresolved pressure on the industrial sector. But during 1Q, the resilience of domestic demand was finally shaken, with repeated disappointments in retail sales and auto sales. At the same time, additions to personal savings rose by 3.6 percent yoy, and the savings ratio rose from five percent in 4Q15 to 5.2 percent in 1Q16, which was the joint-highest it has been since the tax-generated spike of end-2012. Separately, I also estimate that the private sector savings surplus in the US rose from 0.3 percent of GDP in the 12m to 1Q15 to 1.8 percent in the 12m to 1Q16. If confirmed, this will be the largest savings surplus since the middle of 2014. The immediate impact of this was seen in the 1Q GDP estimate, in which growth slowed to an annualised 0.5 percent, largely as a result of non-residential investment falling by an annualised 5.8 percent, and because of business’s increased wariness about holding inventories. In short, behaviour which both anticipated and justified precisely the fall in consumer confidence which April’s survey’s located. |
 Hong Kong trade balance Tuesday 26th April • Hong Kong March trade balance disappoints as deficit widens HK$13.9bn mom to HK$47bn – Exports down seven percent yoy but 1.5 SDs above historic seasonal trend; imports down 5.8 percent and 0.4 SDs above trend – China balance deteriorates HK$10.3bn to HK$5bn deficit – Deficit with Japan widens HK$2.2bn to HK$10.5bn – Surplus with US widens HK$3.5bn to HK$7bn – Balance with rest of world deteriorates HK$4.9bn to HK$38.5bn deficitJapan leading index Monday 25th April • Japan February leading index final revised Down 3pts to 96.8 – Lowest since February 2010 – Leading index down 4.4 percent mom, coincident down 1.4 percent, leading/coincident ratio lowest since 1993! – Leading drags: machinery orders, producers’ inventory ratio, consumer confidence, SME sales forecasts – Positive offsets: housing starts, job offers –––––––––––––– |