Despite a week of mostly negative news, the story of the last month has been one of more surprises than shocks, although this has not yet been enough to haul capital spending indicators back into positive territory. Asia: The improvement in data coming out of China, and also now out of other Asian economies (this week Taiwan and Thailand), is offsetting a new downturn in economic news from Japan. The run of goodish news from China still owes a lot to aggressively supportive policy-making across the board. The key question is whether this strength will spill over to the rest of Asia – so far the signs are equivocal.US: Despite improvements elsewhere in the world economy, and despite a weakening of the dollar and a retreat in bond yields, there’s little sign yet that the US is about to start surprising us with its economic strength. Rather, the data of the last couple of weeks has been largely disappointing, sometimes severely so (industrial output, retail sales). Europe: The ebbing of positive European signals reflects the emerging broad-based weakening of the British economy. In recent weeks, that weakness has encompassed employment, retail sales, trade, industry, construction and real estate. Underlying it all is a decline in real productivity which is undermining the labour market gains which have been central to the UK’s grinding post-crisis recovery. |
 Opportunities and threats As we enter a week of sustained central bank activity, it seems unlikely that decisions will be made which will fundamentally alter the current regime of relatively weak dollar and stabilising/firming commodity prices. This will continue to favour US, Chinese and SE Asian economies at the expense of Japan and the Eurozone.The one new unexpected vulnerability is the emerging weakness in the UK, which should not be dismissed merely as a bout of nerves about the possibility of Britain exiting the EU institutions. Rather, the current bout of weakness reflects the opening of structural faults which will likely result in, at the best, a new ‘soft patch’ in its modest and grinding expansion. Three key surprises Taiwan industrial production recovers sharply Although manufacturing output fell 4.2 percent yoy, whilst electricity & gas jumped 7.4 percent and mining rose 2.5 percent yoy, it really was manufacturing which generated the surprise, with the monthly gain 1.2 SDs better than historic seasonal trends. The negative yoy was merely testament to the extremely high base of comparison: last year, March was manufacturing’s busiest month, with output 7.9 percent higher than what was produced on average in the other months of 2015. The industrial mix can be seen as showing mildly encouraging signals about the short and medium term prospects of the business cycle: capital goods output fell only 1.8 percent yoy and intermediates fell 3.4 percent, whilst consumer goods continued to lag, falling 9.6 percent. Taiwan’s export orders showed similar signs of recovery in March: although they fell 4.7 percent yoy, this once again reflected mainly the strong base of comparison, with the monthly gain 1.4SDs better than expected in March. It reflected primarily a recovery in Northeast Asian demand, but with some contribution also visible from the US. The strongest gains against trend were orders from Japan (1.6SDs better than expected), China and Hong Kong (1.3SDs), Asean (1.1SDs) and the US (one SD). A further sign of stabilisation surfaced in the US dollar pricing of export, which which rose 0.6 percent mom in March, the first monthly rise since June and only the second since August 2014. This stabilisation of export prices was shared also by Japanese and S Korean exporters. Taiwan’s industrialists have long marketed themselves as being among the most flexible and responsive manufacturers in the world, so it is reasonable to expect that the island would be among the first to pick up on any broader upturn in either NE Asia or the world trade cycle. But it cannot be said that the broader run of NE Asia’s industrial data yet shows coherent signs of uplift. NE Asia’s total exports rose 3.4 percent yoy in March, which was the first positive result since February 2015, but the uptick against seasonal trends was only only 0.2SDs – i.e. pretty much what one would expect. When one takes into account trends in output, exports, pricing, inventories and capacity utilisation from China, Japan, S Korea and Taiwan, the best one can say for the data is that during the first three months of 2016, the region continued to leak industrial momentum at much the same pace as it has since the second half of 2014. More proof is needed to conclude that the strength of Taiwan’s March industrial output and export orders are signalling an upturn in the cycle. |
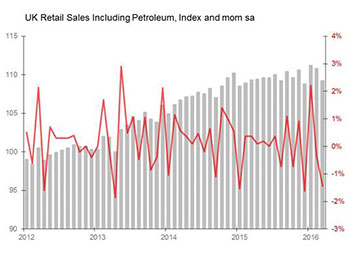
 China 70 cities property prices Friday 18th April • China March 70 cities property prices surprise with net 54 risers mom – 62 cities post mom price rises, up 15; eight cities fall, down seven – Largest proportion of net risers mom since Jan 2014 – In yoy terms, net 11 show rising prices, first positive result since August 2014 – Rising sharpest: Shenzhen up 62.5 percent yoy, Shanghai +30.5 percent, Nanjing +17.8 percent, Beijing +17.6 percent – Falling sharpest: Dandong down 3.8 percent yoyTaiwan export orders Friday 20th April • Taiwan March export orders surprise down 4.7 percent yoy Only – Monthly gain is 1.4SDs above historic seasonal trends – Book-to-bill ratio up 0.10 to 1.61x, 0.8SDs above historic seasonal trends – Drivers: electronics +1.6 percent mom, chemicals down 1.8 percent only, infocomms down 2.8 percent only, electrical machinery down 3.1 percent – Major markets: China & HK down 7.5 percent yoy, US down 2.2 percent, Europe down 4.1 percent, Japan down 26 percent – Stronger markets: Singapore +24.6 percent yoy, ‘Others’ +56.2 percent Three key shocks UK retail sales sag Britain’s expansion is threatened by sagging retail demand, which has its roots in weakening employment markets. But the new fragility of labour markets reflects a structural downturn in productivity. The net result is that the weakness of UK employment growth and retail sales do threaten to herald a period of sustained lower growth, with the current grinding expansion ebbing away through inanition rather than excess. February’s employment data, released this week, showed a sharp deterioration in employment gains, with only a net 20,000 new jobs added in the three months to February, with 9000 lost in February alone. There was no comfort in the details: the number of employees fell 23,000, whilst the number self-employed rose 25,000, the number of full-time jobs rose only 17,000, and the number of vacancies were unchanged in the three months to March. In addition, average weekly wage growth slowed to 18 percent in the three months to February, with wage rises concentrated in construction (up eight percent) and wholesale/retail/hotels/restaurants up 2.7 percent. In other words, wages were rising fastest in the most pro-cyclical sectors of the economy even as the employment foundations of the expansion were being undercut. And in turn, that was reflected in March’s retail sales, which showed ex-petrol sales volumes falling 1.6 percent mom, whilst petrol sales rose 0.5 percent. In value terms, sales fell 1.4 percent mom and fell 0.1 percent yoy, with a monthly movement which was 1.6SDs below historic seasonal trends. This was a sharp enough fall to drag the six month momentum vs trend to minus 0.4SDs, which is the biggest deflection against trend since the beginning of 2010. Lacking significant support from credit growth, Britain’s domestic demand remains keyed to payroll growth. However, the grounds for expecting continued employment growth are currently being undermined by falling productivity. After accounting for changes in capital stock per employee, real output per worker fell 1.3 percent in 2015, the biggest decline since the Great Recession, and extending a deterioration which had begun the previous year. Historically, employment growth does tend to respond, albeit with a lag, to changes in this measure of labour productivity. In short, whilst Britain’s long post-crisis expansion may have been fundamentally acyclical, the spurs behind the current slowdown are now developing their own cyclical features. |
 Japan dept store and supermarket sales Tuesday 19th April • Japan March nationwide dept store sales shock down 2.9 percent yoy – Monthly movement is 2.1SDs below historic seasonal trends, worst since August 2013 – Largest falls: Kobe down 5.7 percent yoy, Hiroshima down 3.7 percent, Yokohama down 3% – Rising sales: Kyoto up 2.1 percent – Clothing down 6.7 percent yoy, accessories down 4.9 percent, household goods down 1.3 percent, but sundries/cosmetics up 2.6 percent • Japan March Tokyo dept store sales shock down 1.1 percent yoy • Japan March supermarket sales shock down 0.3 percent yoy US Philadelphia business activity ––––––––––––––– For more information: To subscribe to Michael Taylor’s Economics Briefing, click here |