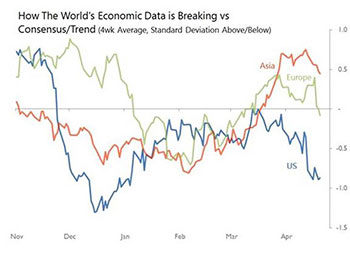
Asia: The economic news from Asia is currently conforming pretty much to trend, with occasional unexpected strengths, such as Japan’s industrial production last week or Australia’s exports this week, offset by similarly unexpected shocks, such as the weakness of S Korea’s imports this week. These signals are not yet cohering into a consistent region-wide economic trajectory. US: The news continues to break weakly in the US, with signs that the labour market is beginning, finally, to feel the pressure from the weakness afflicting the industrial sector for the last 18 months. However, that pressure is unlikely to develop too greatly, as there are still near-record levels of unfilled vacancies. Europe: Although this was a poor week for European data, the tally was heavily influenced by the large number of Markit’s purchasing managers’ indexes, which have little practical value. |
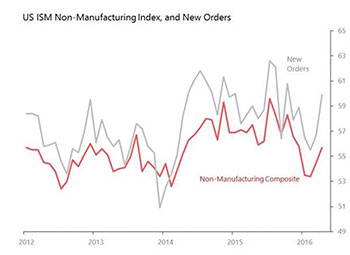
 Opportunities and threats In the face of the currently weak run of global data, it is becoming tempting to take a contrarian view on the world economy’s medium term prospects. The reason is that the current weaknesses are showing up in parts of the world economy which have stronger foundations than is immediately obvious. For example, if US labour markets remain robust, domestic demand will almost recover momentum: current labour market data isn’t encouraging, but underpinning its prospects are near record levels of vacancies. Or take the discouraging demand data from the Eurozone, with unexpectedly weak retail and vehicle sales: it is difficult to expect this to remain the trend given the productivity and employment gains quietly being made.And on the top of all this, there remains the modest tail-wind generated by the weakness of the dollar. Already this is beginning to show up in, for example, the pricing of Asian exports, and the renewed rise in Asian foreign reserves. Three key surprises US ISM non-manufacturing composite The result was genuinely surprising, both because this was a real break against the declining trend which has prevailed since the middle of 2015 (as the graph shows), and because of the weakness of US domestic demand during the past few months. In addition, most confidence surveys have been in decline, and that caution is reflected in a rising savings rate: March’s 5.4 percent savings rate was the highest since the tax-affected rates of late 2012. April’s domestic demand data shows a few signs of some modest rebound, with average weekly earnings up 0.5 percent mom, car sales up 9.5 percent yoy, and the IBD/TIPP economic optimism index also recovering sharply in May (see below). But these are modest and tentative gains to set against the clear loss of momentum during 1Q. And they have been offset by a consistently disappointing set of employment data for April. Overall, then, until this recovery is confirmed by subsequent strengthening of indicators of domestic demand, it is probably best to treat this surprise with caution. |
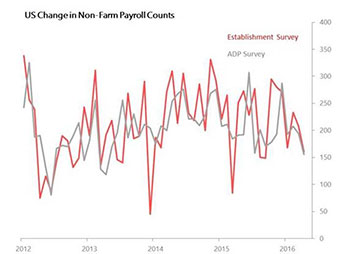
 US IBD/TIPP economic optimism Tuesday 3rd May • May IBD/TIPP Economic Optimism Index surprises up 2.4pts to 48.7 – Best since May 2015 – Personal financial outlook up 3pts to 61.1 – Economic outlook up 2.9pts to 43.5 – Federal policies up 1.3pts to 41.6 Indonesia CPI Three key shocks US employment data The downturn in US labour market data recorded in April is responding to a modest but still developing fall in labour productivity (not accounted for by changes in capital per worker). Although April’s non-farm payroll data, household survey employment data and labour participation rate all look less alarming in their detail than in the headlines, the slowdown is real enough. It is, however, likely to be limited by the historically high level of unfilled vacancies in the economy. The week presented a fairly comprehensive set of data showing the slowing of the labour markets in April. The highest profile result was the disappointing 160k rise in non-farm payrolls made in April, which was the lowest since September 2015. This result had been foreshadowed earlier in the week by ADP count of private non-farm payrolls, which showed a rise of only 156k, which was the lowest since April 2013. In addition, the household survey of employment reported a fall of 316k: the first negative result since September 2015 and the weakest result since October 2013. In fact, the non-farm payrolls result was not quite the disaster it seemed: hiring slowed by 48k mom, but roughly three quarters of the slowdown emanated from the government sector, which shed 11k (having hired 24k in March). Meanwhile, the private sector is hiring, with a sharp acceleration in the professional and business services sector, with improved contributions from education and health and financial services, whilst the slowdown was concentrated in retail and construction. Nevertheless, the trends shown in both the Labour Bureau and ADP surveys are one of statis during much of 2014 and 2015, gradually turning into a slowdown. At the root of this is the slide in output per worker, when deflated by capital per worker, I estimate fell by one percent yoy in both 4Q15 and 1Q16, with the fall accentuated by the slowdown in overall GDP. Even before adjusting for capital per worker, output per worker was flat yoy in both 4Q15 and 1Q16. These estimates are similar to those found in the Bureau of Labour Statistics 1Q survey, in which output per hour was found to have fallen for a second successive quarter, by one percent qoq seasonally adjusted (sa). Historically, when labour productivity falls, hiring tends to slow. |
 Indonesia 1Q GDP Wednesday 4th May • Indonesia 1Q GDP disappoints +4.92 percent yoy – Quarterly fall of 0.34 percent qoq is one SD below historic seasonal trends, partly revokes 4Q’s 1.3SD surprise – Drags: business investment down 5.75 percent qoq, exports down 3.44 percent – Positive offset: financial services & insurance +9.1 percent yoyUS imports Wednesday 4th May • March Imports shock down 3.6 percent mom sa – Before adjustments, imports down 9.3 percent yoy, with monthly movt 2.1SDs below trend, reversing February’s 2.3SD surprise – Goods down 4.3 percent mom sa, services down 0.5 percent – Consumer goods down 9.9 percent mom, F&B down 5.9 percent, capital goods down 3.2 percent, industrial supplies down 2.9 percent, autos down 2.6 percent – Imports of petroleum products +9.4 percent mom by volume, +11.2 percent mom by value –––––––––––– |